

In-situ IR Spectroscopy for CO2 Electrocatalytic Reduction
Contents
1. Several in situ electrochemical infrared attachment structures
1.1 IRAS
1.2 fully reflective of decay
1.3 Internal reflection ATR-SEIRAS and internal reflection Otto thin layer mode
2. Experimental care
2.1 Selection basis for internal and external reflections
2.2 Crystal selection
2.3 Entry angle
2.4 Up and down.
2.5 Optical choice
2.6 Choice of electrochemical pools, single and dual rooms, flow and static
2.7 Surface enhanced infrared care
2.8 Choice of electrochemical test methods
2.9 Environmental or electrolyte-related species spectrometry
2.10 Sweeping of optical components
2.11 Electro-pre-treatment
Infrared spectroscopy detection CO2Summary of applications
3.1 Detection of intermediates
3.1.1 CO intermediates
3.1.2 COOH,COO–Centre
3.1.3 OCO, OOCCOH intermediate
3.1.4 CHO intermediate
3.2 Effects of electrolyte (detection of micro-environments of electrode interfaces)
3.2.1 Effects of anion
3.2.2 Effects of anion
3.2.3 Calculation of pH
3.3.4 Effects of additives
Outlook
4.1 Associated with DEMS
4.2 Out-reflection and Otto Tectonic Flow Pool
4.3 Infrared in situ detection of MEA electrodes
References
Infrared spectroscopy detection of water system CO2Attention to the electrocatalytic reduction process
1. Several in situ electrochemical infrared profiles
Infrared spectroscopy can be used to detect adsorbent species on solid electrodes at in situ, using molecular vibration characterization, thus (1) identification and configuration of key intermediates (2) determination of the electrode surface state (3) priority response path and selective identification (4) detection of the effects of the reaction environment, such as electrolytic anion, anion, pH, additives, etc. (5) detection of the double electrolyte interface. For hydro- or non-hydrogen electro-catalytic response, e.g. CO2RR, Her, OER, ORR, MOR, EOR, NRR, Nitrate root reduction, organic electrolytic synthesis, etc.
1.1 IRAS
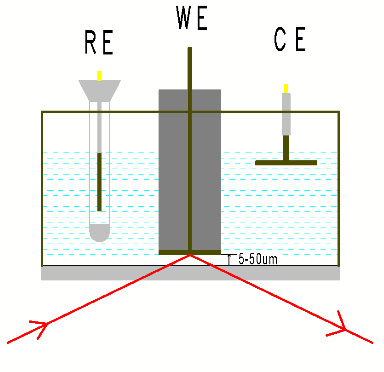
IRAS or IRRAS, also known as the external reflection mode, or the trans-reflection mode, smooth electrodes (the base of carbon electrodes, smooth metal electrodes or FTOs) or the coating or deposition of electro-catalyst droplets onto the smooth electrode poles, crushing the infrared window to form an electrolytic layer (1-10 micrometres), which passes through the optical window through the electrolytic fluid layer, then reflects infrared light on the electrode surface and finally reaches the infrared detector. The external reflection model usually selects Caf2Windows, which typically have a shape around 2 mm thick, are also frequently used in gradients, hemispherics or semi-cylinders.
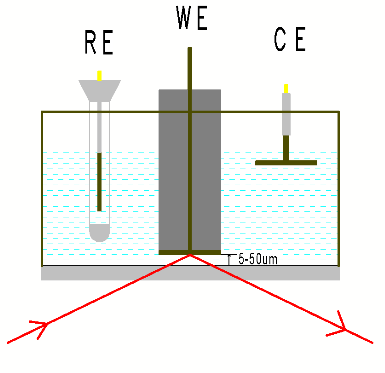
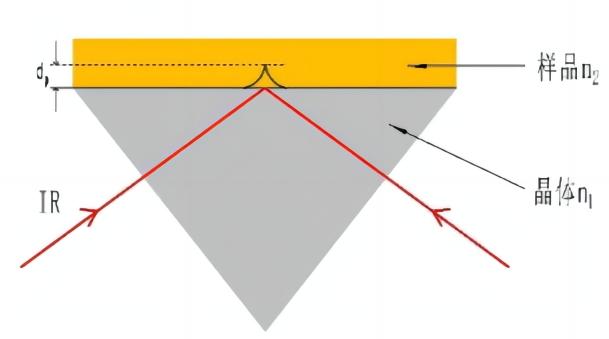
Figure 1 Extra-reflective diagram Figure 2 Description of ATR principles
1.2 Interpretation of full reflection principles of decay
The rationale for the full reflection of decay: Infrared light re-enters the surface of the sample with a high rate of refraction through a crystal with a low rate of refraction, and when the input angle is greater than the critical angle, the incoming light produces a full reflection. In fact, infrared light is not fully reflected back, but rather re-enters the surface after penetrating to a certain depth within the surface of the sample, during which the sample is selectively absorbed within the area of the injecting light frequency, with a reduced reflection light intensity, producing a map similar to that of the perforation, thus obtaining structural information on the chemical composition of the surface of the sample. See Figure 2 ATR Logic Chart. The depth of infrared light penetration through the crystal interface is related to the crystal refractive rate and the angle of injection, and the refractive rate of common crystals is shown in table 2, the greater the refraction rate, the smaller the penetration depth.
1.3 Internal reflection ATR-SEIRAS and internal reflection Otto thin layer mode
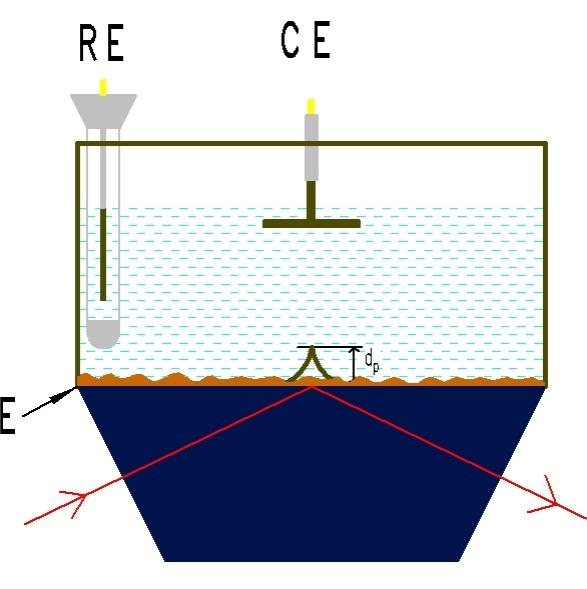
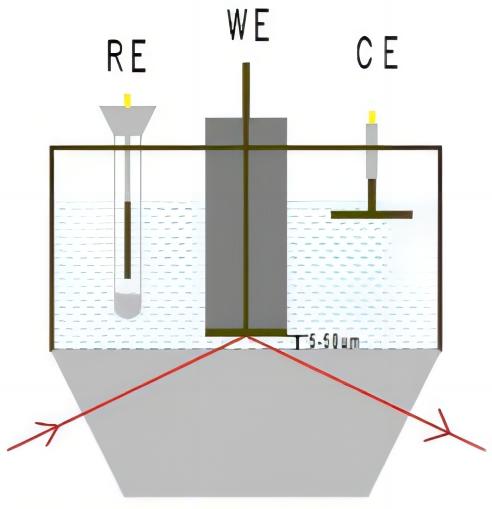
Figure 3 Internal Reflection ATR-SEIRAS Figure 4 Internal reflection Otto thin layer mode
The internal reflection ATR-SEIRAS model, also known as the Kretschmann construction, as shown in the figure above, chemically plating or vacuum plating an island membrane on the ATR crystal (ZnSe, Si, Ge) plane, coating on the top of the metallic membrane or electro-sedimentation catalyst, and the membrane as a conductor base, while acting as a surface booster, increasing the infrared signal of the catalyst ‘ s surface ads to molecules 10 – 1,000 times more than the signal when it is not. This is called the surface enhancement infrared effect, SEIRAS. There are different ranges of pH for different crystals, and different spectrum ranges, as detailed in table 2.
The difference between the internal reflection Otto thin layer model, similar to the external reflection structure, is that the general selection of decaying complete reflection crystals, such as ZnSe, Ge, Si, diamonds, in the internal reflection Otto thin layer model, is based on the reflection principle of ATR, as shown in figure 4.
22. Experimental care
2.1 Selection basis for internal and external reflections
|
Electrochemical pool
|
Selectable crystals |
Passage |
Distribution of electrical field lines |
Electrical material requirements |
Detectable species |
|
Kretschmann (ATR-SEIRAS) |
Diamond,Si,Ge,ZnSe |
It’s not thin. There’s little resistance. |
even |
Metal membrane + dripping or electro-deposition catalyst |
Absorption |
|
Reflect Otto thin model in ATRPattern |
Diamond,Si,Ge,ZnSe |
Thin construction. Passive resistance. |
Uneven |
Mirror smooth or rough surface catalyst (e.g. carbon paper or foam nickel load) |
Adsorption + solution phase |
|
IRRAS |
CaF2 |
Thin construction. Passive resistance. |
Uneven |
Mirrors, such as carbon electrodes, smooth base electrodes + droplets or electro-deposition catalysts |
Adsorption + solution phase |
Table 1 Comparison of Electromagnetic Infrared Spectrospectral Chemical Pool Structures
2.2 Crystal selection
|
Crystal type |
Spectrum range (cm)-1) |
pH range |
Refraction rate (the greater the refraction rate, the smaller the penetration depth) |
|
ATR mode crystal |
|||
|
Diamond |
525-4000 |
1-14 |
2.42 |
|
ZnSe |
520-4000 |
5-9 |
2.40 |
|
Si |
1200-4000 |
1-12 |
3.40 |
|
Ge |
575-4000 |
1-14 |
4.00 |
|
Out-reflection mode crystal |
|||
|
CaF2 |
1100-4000 |
5-8 |
1.43 |
Table 2
2.3 Entry angle
In both ATR and external reflection measurements, the angle of the input angle and whether or not to opt for a partial oscillation as a source of light determines the spectral strength obtained; theoretically, a larger angle of entry (70-80°) would be better. However, as the beam follows the input angle on the interface and the general electrode size is 1-2 cm in diameter, no significant signal enhancement was observed when the angle changed at 60-80°. The same optical attachments may be used for external and internal reflection ATR-SEIRAS, using 60 or 65° light.
2.4 Up and down.
Infrared spectrospectral maps are presented in both the sorbence and passivity, are mutually upward and downward, facilitate discussion, assuming that, for a reference map (usually a straight line) at a given level, a species is consumed if a positive peak (i.e. up) is produced, and if it is a down (i.e. down) a species. If, for specific reactions, the penultimate interpretation of the consumption of a species is not clear, or when the peak of a given range is abnormal, it may be related to two other factors: (1) the injection angle (2) the volume filling factor of the metal particles (SEIRAS base or nanocatalyst particles) by the metal party, note: not the size of the particles.
2.5 Optical choice
There are two types of light circuits currently commonly used: a fixed radial attachment with an input angle (generally 60-70 degrees) and a radial attachment with an input angle that can be reconciled (30-80 degrees). Angular optical attachments, which have increased the loss of light energy by increasing the number of lenses through the use of a combination of plane mirrors and non-platform focus mirrors, and a light-route system using a single-reflection attachment, which has reduced the loss of energy due to the lack of multiple reflections, benefit from a high sensitivity MCT detector and are available in both ways with a high-quality spectrum.
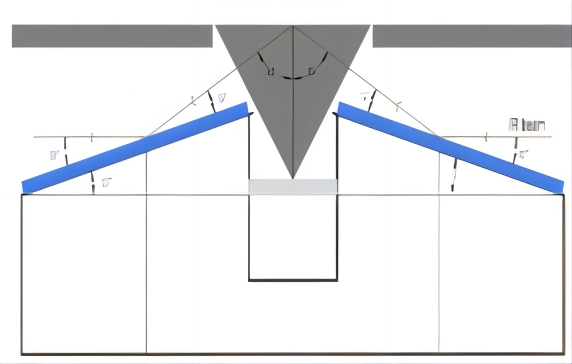
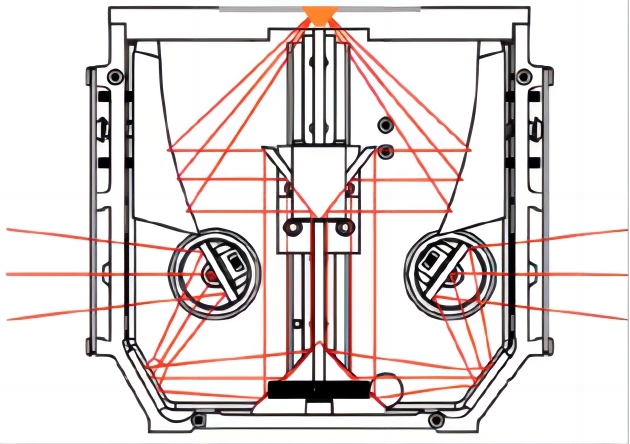
Figure 5 60° map of angle light Figure 6 VeeMaxIII light map
2.6 Electrochemical pool selection (single and double chamber, flow and stationary)
The Electrochemical pool is very diverse and has a single chamber (i.e., three electrodes in the same chamber) and a double chamber. Dunwell and others[4]The system studied electrolyte purity and the type of electrodes, and the results recommended:2Emission reduction, recommended for double cavity rooms, proton exchange membrane will isolate electrodes from working electrodes to avoid reactions to the spread of electrodes to working electrodes (2) with highly pure reagent configuration electrolytic fluids, and sometimes with pure electrolytics (3) with carbon rods for electrodes rather than Pt wires. Because Pt dissolves, it may spread to the cathode, and Pt is a good catalyst for hydrogen analysis. Malkani et al. provided a detailed comparison of flow and static CO-reducing effects, with studies showing better passivity in case of mixing. It needs to be noted, however, that in practice there are catalysts that fall off the crystal surface in a state of intense convection, making the experiment impossible to move forward.
The ATR-SEIRAS model, or the Kretschmann model, only applies to powder catalysts or other catalysts for electrode deposition on metallic membranes. Catalytic catalysts such as large electrodes or carbon paper are not visible and therefore reflector or Otto models are occasionally used.
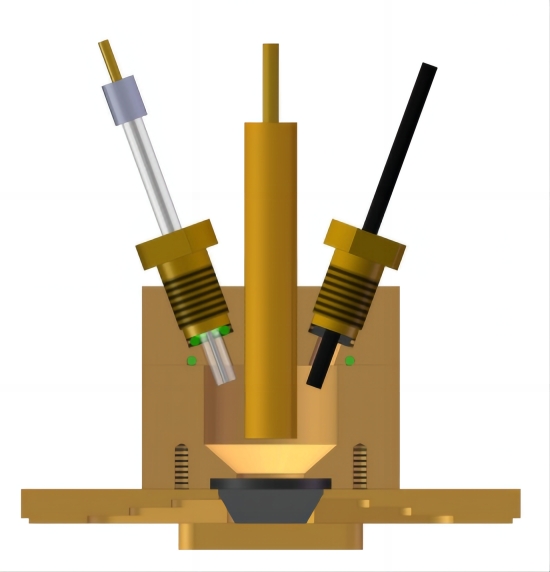
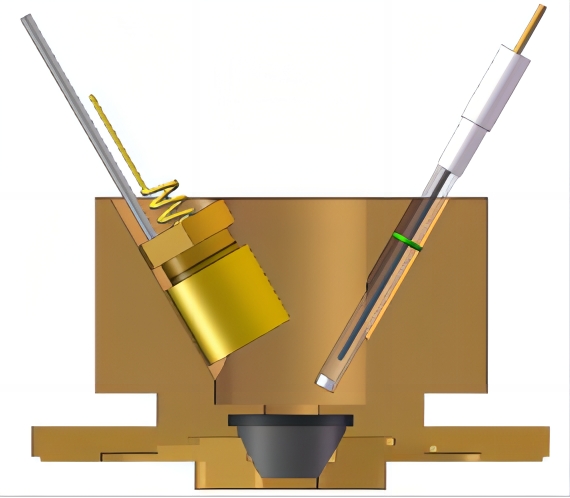
Figure 7 External reflector chemistry pool Figure 8 Imaging double cavity electrochemicals
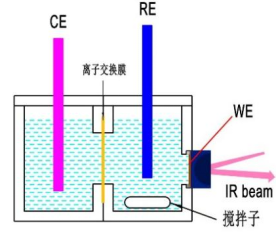
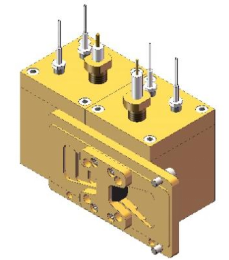
Figure 9 Diagram of diaphragm mixed electrochemical pool Figure 10 Double cavity mixing electrochemical pool
2.7 Surface enhanced infrared attention
(1) The strength of the spectrum is dependent on the surface shape of the metal, which is well enhanced by the metallic metallic membranes prepared for vacuum evaporation and electrochemical deposition;
(2) Physical adsorption and chemical adsorption molecules are enhanced and generally chemical adsorption molecules are more intense than physical adsorption molecules;
(3) The first layer of molecules directly connected to the surface of the metal has the strongest signals, and the multiplier effect declines as the surface distance of the electrode increases, i.e. the surface enhancement is a short-range effect.
Preparation of the SEIRAS base
Many materials can be used as a base for metal deposition, such as Ge, Si, ZnSe, CaF2Wait. The chemical properties of the base itself are important factors influencing the enhanced effect, as it determines the surface shape of the sediment membrane. The grinding and cleaning of the base before each deposition is a factor in the tube to ensure the replicability of the experiment, and in some cases the surface restoration of the base also affects the enhancement.
(1) Nanofilm for dry law and order
There are mainly vacuum plating and spattering. The enhancement of metallic membranes is influenced by physical features, particle size and island particle density. For vapour plating, a lower sedimentation rate (0.1-0.5 nm/min) would facilitate a better enhancement.
(2) Wet legal nanofilm
Chemically plating has greater metallic membrane particles than vacuum plating membranes, much greater viscosity between the au membrane and silica base prepared by chemical deposition, and larger SEIRAS enhancements, probably because there is no oxide between the base and the gold membrane, i.e. before the chemical plating, the silica surface uses NH first.4F remove surface oxides. In addition, the enhanced electric field will decay within the oxidation layer, so the prepared metallic membrane should be used as soon as possible, or electrochemically washed before it is used.
2.8 Choice of electrochemical test methods
Electrochemical methods commonly used in in situ electrochemical infrared spectroscopy are LSV/CV, time current method, single-step steps, multi-step steps, square-volam. The appropriate spectral data collection based on the electrochemical method chosen is manual and automatic.
2.9 Environmental or electrolyte-related species spectral peaks
(1) Free HCO in electrolyte3–and CO32-Other Organiser
1361,1310cm-1 : stretching modes of bicarbonate in solution
1400cm-1 :asymmetric stretching of dissolved carbonate
1650cm-1 : asymmetric C-O stretching mode of bicarbonate ions
(2)H2A map of O.
OH: 3400 cm-1 , HOH bending: 1645-1650 cm-1
Because there are many important intermediates such as OCO, OOCAH, CHO, COOH, COO–The peak is 1300-1800 cm.-1The HCO that we’re discussing.3 –and CO3 2-H2O peaks overlap and water is at 1650. cm-1The nearby absorbent peak is strong and wide.2O Configure electrolyte, avoid H2O generated 1650 cm-1 ,
D2D-O-D of O peaked at 1200 cm -1
D2O-D of O peaks at 2600 cm-1
(3)CO2Image
CO2OCO in the molecule produces 2344 cm asymmetric condensation.-1Infrared absorption peaks need to distinguish between optical mirror space and CO in spectral mainframe circuit space.2(i.e. CO in the atmosphere)2CO in solution2This part of CO2It’s a CO.2The two peaks, CO in the solution.2Peaks are single, CO in the atmosphere.2It’s a double-peaker. It’s easy to distinguish in shape.2The two peaks are the CO in the atmosphere.2We’ve been detected. We can blow a stable, atmospheric CO.2the baseline map [3].
2. Cleaning of 10-ray attachments and spectrometers
CO in the atmosphere due to the lack of adequate spectroscopy and accessories2It’s detectable, it’s detectable in the air at the same time.-1It’ll extend to 1800 cm at the same time.-1This would have a very negative impact on the quality of the in situ infrared spectrograph (increased noise and masking the weak peaks of some intermediates), and it would therefore be necessary to have sufficient blow-outs, which would normally be associated with the mainframe and accessories of the spectrometer, with nitrogen or compressed air, sometimes even at large current speeds of several hours in advance, in order to obtain a high-quality spectrograph.
2.11 Electro-pre-treatment
Some catalysts are oxidized for long periods of time in the air and need to be preserved in the inert gas climate or under other conditions. Some catalysts require electrochemical cleaning, such as chemical plating or splattered plating surface enhancements of the base, typically through multiple cleaning of CV electrochemically in high chlorine acids, followed by drip spraying or other catalysts by electric deposition.
Infrared spectroscopy detection CO2Summary of applications
Current detection of CO using infrared spectrum2The main intermediates for the electrocatalytic reduction response are:
(1) CO intermediate, linear adsorption of CO: 2000-2100 cm-1, bridge to CO 1800 cm-1Around
(2)CHO 1720-1760 cm-1
(3)OCCO1562 cm-1And OCCOH1584 cm-1,1191 cm-1
(4) COOH and COO–
Different catalysts, different electrolyte environments, combined with the Stack effect, tend to shift peak positions.
3.1 Detection of intermediates
3.1.1 CO intermediates
CO is a lot of CO.2The product of the catalytic reaction of the electro-catalyst is also an intermediate product, while CO can act as a probe molecule, so the detection of CO intermediates is of great importance, such as CO or CO by detecting CO adsorption configurations on the surface of the catalyst and CO cover of various adsorption configurations (1).2A strong and weak combination with the catalyst, thereby manipulating the catalyst towards C1 or C2+The product is selective, (2) indirectly detects the process of surface morphology of catalysts, and catalysts are frequently reformed in the process of electro-catalytic response, (3) detects the double layer structure. CO intermediates such as Pt [7], Au [8], Cu [9], Pd [10] surfaces were observed on many single-metal crystals or polycrystals. of which Bridge adsorption of CO [9-11] can be observed on the surface of Au, Pd, Cu etc. Studies have shown that bridge adsorption of CO in Cu or Cu oxide surface [12-13] is inert and cannot be further restored to C2+ product, only as an bystander, but its coverage affects linear adsorption of CO, indirectly affecting C2+ Selectivity of products and activity of catalysts. Controlled copper surface oxidation, which regulates linear or bridge adsorption of CO, thus controlling reaction selectivity [13].
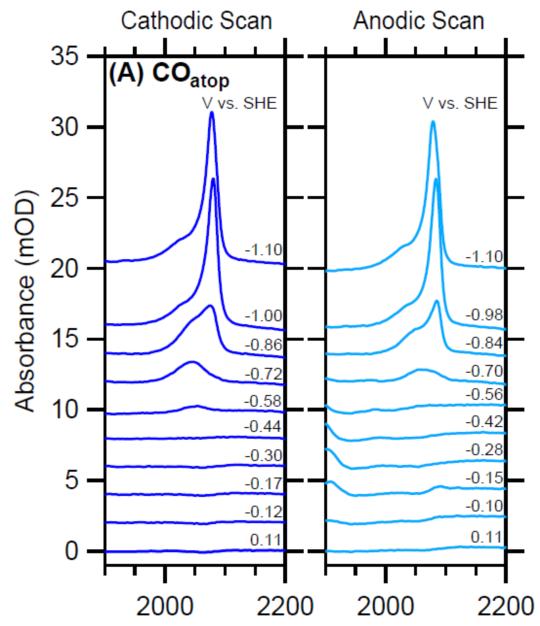
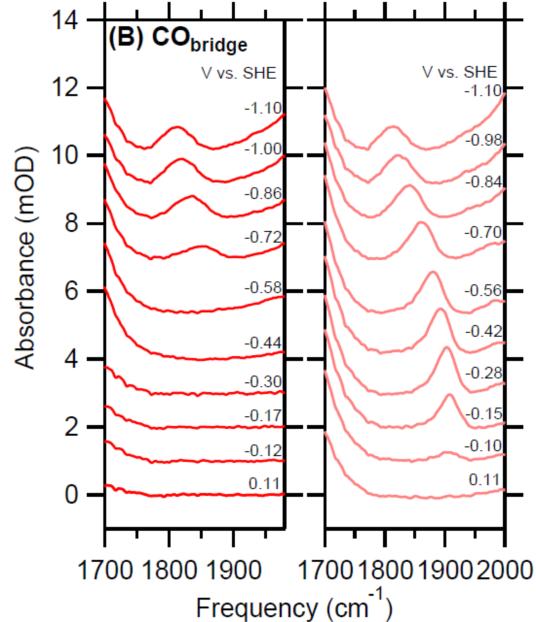
Figure 11 IR spectra of the C≡O stretch mode of (A) COatop and (B) CObridge collected during a CV sweep in CO-saturated 0.05 M Li2CO3 at a scan rate of 10 mV/s. The cathodic forward and anodic backward scans are shown on the left and right panels, respectively【12】.
3.1.2 COOH, COO-Intermedian
Ag is a catalytic CO.2The restoration of a very important catalyst for the production of CO, which can be seen on the surface of Ag catalysts.–Intermediate [14]. Shuai Chen et al. [15] also observed COO on the surface of Au using the Otto-ATR model–。
Firet et al. [14] used ATR-SEIRAS to study Ag’s surface CO2Electro-reducing path, with moderate perturbation, identifies proton-coated electronic transfer as the main CO2Response path. However, COO- and COoh intermediates were detected at very negative voltage, indicating that individual proton and electronic transfer steps occurred, providing a different path at lower power levels. These results show that CO2Reverting mechanisms depend on power dynamics. Not all of them contain a central proton coupling electronic transfer.
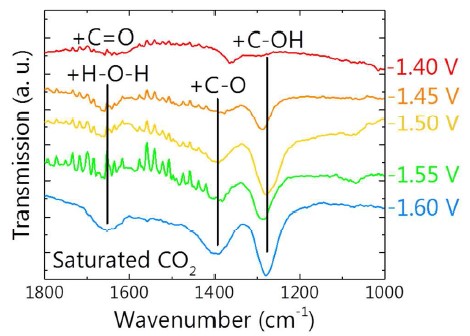
Figure 12 ATR transmission spectra in saturated CO2 0.1 M KCl electrolyte at different potentials showing the peaks that belong to the CO2 reduction intermediates. The background for these spectra was taken after 30 min at the same potential under a nitrogen purge[14]
3.1.3 OCCO and OCCOH intermediates
DFT theoretical calculations indicate that on Cu Catalyst C2+The product will form the C-C key by means of an intermediate fusion of CO, but direct spectral evidence is difficult to capture, i.e. reports of direct infrared spectral observations of the OCCO or OCCOH intermediates are limited. Koper Theme Group [16] Direct observation of CO2 polyhydrogenization concept OCCOH, 1584 cm during infra-red in-field on Cu(100) electrodes-1And 1191 cm-1I don’t know. Younghye Kim et al. [17] direct observation of OCCO (1562 cm) on the Cu surface and Cu (OH) 2-dived Cu surface of the electron deposition using ATR-SEIRAS-1) Middle path, not passing CHO (1760 cm)-1) The intermediate, with the observation of the CHO intermediate as an intermediate for CH4 products. On-site real-time test results CO2 concentration and linear adsorption of CO (2057 cm)-1) adsorption occurs simultaneously and faster (about 5s), while proton coupling is slower to form CHO (about 30s). This work directly observed the evolution of several intermediates of the electrode surface and further increased the understanding of response mechanisms.
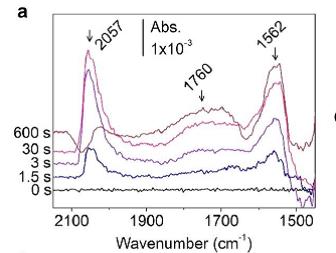
Time-resolved IR spectra with 1.5 s inputs for 10 min The spectra were taken in 0.1 MKHCO3 D2O electrolyte at -0.94 V on (a) ED-Cu,with baseline spectrum at -0.37 V in CO2 saturated electrolyte[17]
3.1.4 CHO intermediate
CHO intermediate infrared signals are weak, Shangqian Zhu et al.[9] directly observed 1720 cm-1, compared to 1741 cm in theory, on the surface of Cu-1Closer. CHO was also observed by Younghye Kim et al. [17] and experiments showed that CO adsorption formed faster than CHO.
32 Effects of electrolyte
3.2.1 Effects of anion
Lots of electro-catalyzed COs.2The retroactive reaction was carried out in hydrocarbonate electrolyte, due to the pH buffer capacity of the hydrocarbonate on the one hand, and as CO on the other.2The source library. The Binjing Xu team[8] has systematically studied the key role of hydrocarbon carbonate roots on the gold surface, using formulae for Electrochemicals, ATR-SEIRAS, isotope tags and in situ mass spectrometry, and has shown that carbonate hydrogen roots pass and dissolve CO2To reach a balanced exchange, form CO on the gold surface, not supply dissolved CO.2Direct participation in response. The author suggested the carbonate roots and dissolved CO.2By striking a fast balance, we increase CO in the vicinity of the electrodes.2Concentrations increase the rate of production of CO. Minhua Shao team [9] also demonstrated the presence of HYPCO2 through dissolved balance by using isotope markers and ATR-SEIRAS on the copper catalyst surface2The electro-catalyzed reduction formed linear adsorption of CO and bridge adsorption of CO on the surface of the electrodes.
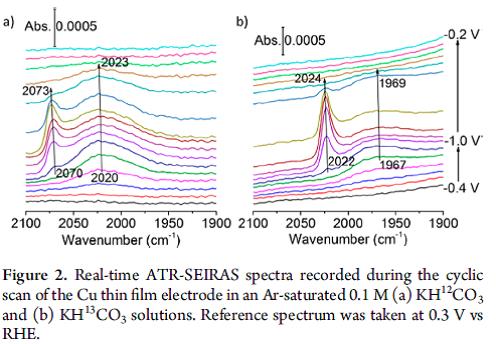
Figure 14 Real-time ATR-SEIRAS and (b) KH13CO3 solutions. Reference spectrum was taken at 0.3 V vs RHE [9]
Deng Wanyu et al.[18] studied gold and copper surfaces in Ar saturated KCl and KHCO using ATR-SEIRAS3CO in electrolyte2It’s not like we’re going to be able to do this.It’s confirmed there’s no external CO.2It’s from HCO.3–It’s a product of CO. Unlike electronic exclusion, carbonate roots with negative charges are found to accumulate near the surface of the electrode. The mechanism for reducing the carbonate roots is that the carbonate roots are not adsorbed to the surface of the catalyst, but are converted to CO.2This increases the concentration of exposure near the electrodes. The study also found CO.2The electro-catalytic activity is proportional to the concentration of hydrogen carbonate roots in the body and to the cathode power. In particular, local hydrocarbon roots of carbonate are controlled by cathode power and eventually reach a level.Station。
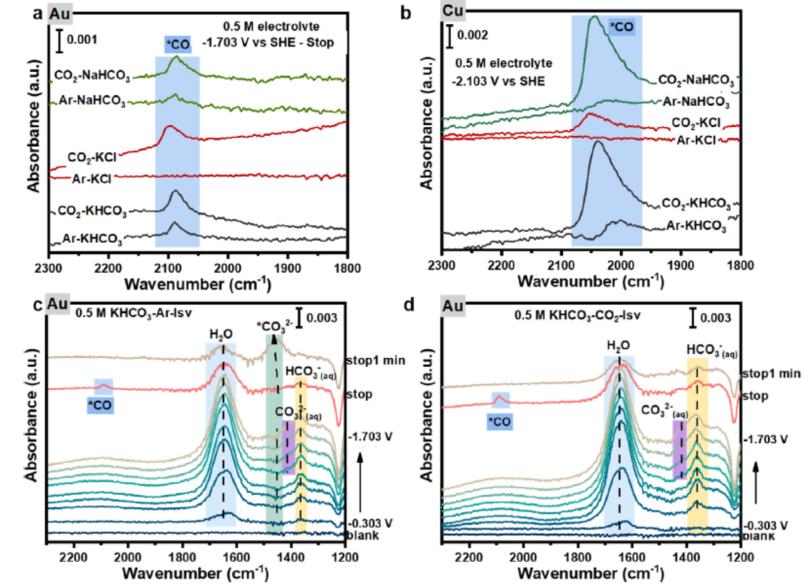
Figure 15 (a) In Stu ATR-SEIRAS of Au filmed after stopping physical at -1.703V in
different solution (b) in situ ATR-SEIRAS of Cu film recorded at -2.103 V in different solution
In situ ATR-SEIRAS of Au film recorded during the LSV test in Ar-saturated (c) and CO2-saturated (d) 0.5 M KHCO3 solution[18].
Guido Mul et al. [19] studied CO adsorption coverage systematically on the copper oxide surface by regulating the composition of the electrolyte to the regulatory pH. Studies show that CO cover increases with pH and ethylene selectivity. The study highlighted the ethylene selectivity associated with the reaction CO fraction pressure and the composition of the anion.
3.2.2 Effects of anion
The nature of electrolytic ion affects CO.2Faraday efficiency and selectivity in electro-recession, which Singh et al. [20] consider to be a difference in the buffer capacity used for the hydrolysis of the hemoplasm in the double layer. They argue that the drop in pKa near the electrode surface is due to the polarization of the solvent molecules between the positive charged anion and the negative electrode surface. Angel Cuesta[21] confirmed this statement on the surface of gold through infrared in situ experiments. Experiments confirm the order in which pH increases with ion size on the interface: Li+>Na+>K+>Cs+I don’t know. Electrolytic electrolyte interface regulation is essential and Barnerjee et al. [22], in conjunction with in situ infrared detection of CTAB and different alkaline metallic anional infra-water infra-red and C-H peaks, have been observed to effectively replace the alkaline metallic anion with a positive charge in surface active molecules and have inhibited the dialysis of hydrogen. But catalyze active and selective alkaline metallic anion dimensions when CTAB exists.+, Na+, K+It’s not relevant. The author argues that CTAB and alkaline metallic anion compete for the location of the outer Hemhez layer. The reduced activity of ethylene is due to increased hydrophobicity of the interface as a result of the accumulation of surfactants.
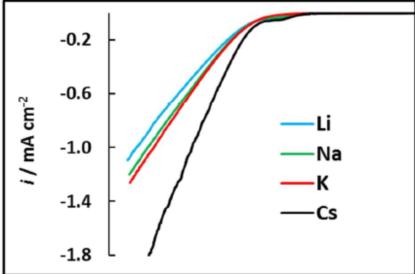
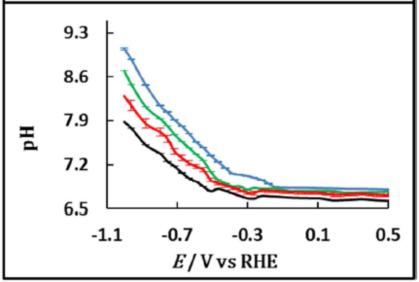
Figure 16 LSVs at 1 mV s1 (top Panama) of a sin-film Au electrode on Si in CO2 -saturated 0.05 M M2CO3 solutions (M = Li (blue), Na (green), K (red), Cs (black)) in D2O, and potential dependence of the interfacial pH[21].
3.2.3 Calculation of pH
The electrolyte pH to CO.2Catalysing is an important original effect, and it’s actually a local pH micro-direction of electrodes.2The electro-catalytic reduction response is very different from the pH of the liquid matrix in the electro-catalytic reduction process. Dunwell et al. [23] Using SEIRAS on the gold model catalyst surface, direct in situ detection of CO2Changes in electrodes surface pH during retrofitting. Local pH is assumed by detecting changes in the infra-red absorption peak area of carbonate root (1400) and hydrogen carbonate root (1362) in response to electrical power. The detected interface pH then examines their effects on electrodynamics in conjunction with the associated concentration excess. The results show that CO2Saturated Nhoco.3Solvent, in -1.0V vs. RHE electrolytics produce a concentration excess of more than 150 mV. Increased buffer capacity for currents and electrolytes can mitigate the concentration gradients on the surface of electrodes. Smith et al. [24] using copper-spattered catalysts on Ge crystals and SEIRAS in situ detection of electrode interface pH, experiments have shown that even the commonly used high buffer capacity phosphate buffer solution is catalytic in CO2The pH, which does not maintain an electrode interface, is a significant increase in the surface pH. Even increased concentrations of phosphate do not mitigate local pH changes, which may lead to increased hydrolysis responses and loss of buffer capacity within a narrower level.
3.3.4 Effects of electrolyte additives
Papasizza et al. [25] reported on [EMIM] BF4/H2Mixture (18% mol/mol) CO2Revert. This is not the case. Adsorption of CO has been observed, increasing the coverage of CO adsorption with negative increase in the level of power, and establishing a balance between dissolved CO and adsorption of CO in electrolyte. Infrared spectra explains the existence of two different types of water, Bulk-like water and RTIL-like water, on the interface. When CO exists2, and RTIL-like water is consumed. It shows this type of water as CO.2Proton supply source for electrical reduction. No EMM+-CO observed in this system.2 Complementary intermediate.
Zhuoqun Zhang et al. [26] Use SEIRAS to detect CTAB effects on interface water and CO2Revert the middle. Her suppressed discovery was due to the replacement of interface water from the appearance of CTAB in the double layer. Enhanced CO2Retroactivity rates may be associated with increased linear adsorption of CO and low-frequency CO peaks. The results analysed the role of additives and established a useful methodology to guide product selection.
Dunwell et al. [27] on the Pt catalyst using SEIRAS-detected electrolytic fluids2It’s a power-driven reduction.
I’ve seen COOH with or without it.LThe middle. Come on, Cooh.LThe middle has increased. This is also consistent with production of acid and CO. Present adsorbed COOHLIt’s the general meso that forms the acid and CO. COOH as the concentration of platinum in electrolyte increasesLCentreThe increase in coverage compared to adsorption of CO is consistent with observed increases in production of soyate and CO. Cooh, the author suggested adsorbing.LIt is a common intermediate that, in the formation of the soyate and CO products, promotes the soyate path when the argon appears.
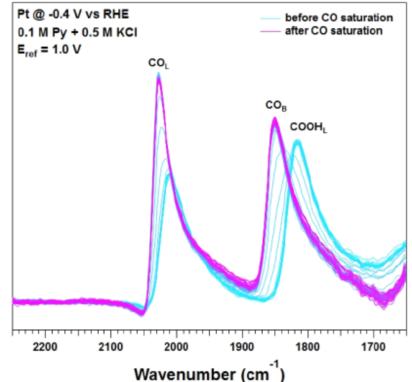
ATR-SEIRA spectra (4 cm-1 resolution, 8 co-added scans)
4. Outlook
4.1 Associated with DEMS
It’s hard to get a full picture of CO by just one analytical method.2The electrocatalytic response, the in situ infrared detection of adsorption intermediates, has important application advantages, but some volatile or non-infrared intermediates or products are important complements to the in situ mass spectroscopy, which is a powerful tool for the qualitative and quantitative analysis of substances in order to gain a better understanding of the process of electrocatalytic reduction. Like the in situ electrochemical mass spectrum DEMS in electro-catalyzed CO2Application in electrical reduction:
(1)HER,CO2RR competitive response analysis, calculation of current efficiency
(2) Rapid calculation of the efficiency of the gas phase relative to Faraday
(3) Confirmation of the initial generation of electrical levels of products or volatile intermediates
(4) Isotope markers, tracking of elemental paths, reaction path resolution
(5) Rapid Evaluation Screening Catalyst
Jinyi Li et al.[28]The chemical and electrostatic interactions between CO and liquid reaction environments of surface adsorption were studied using DEMS and SEIRAS. Use a series of quaternary alkyl ammunium anion (methyl4N)+, ethyl4N+, propyl4N+, and butyl4N+The system regulates the environmental characteristics of the liquid. Discovering methyl4N+And ethyl4N+Ethylene generation at anion, propyl4N+And Butyl4N+Two environments were not created. SEIRAS indicates that the anion does not prevent CO adsorption points and that the interface electric field on which the anion depends is too small to affect the selectiveness of the reaction. SEIRAS indicates that the surface adsorption of CO and interface water at the time of the presence of the two large anion does not result in an inter-molecular reaction. It is shown that the interaction between molecules promotes the hydrogenation of CO to ethylene on the surface. The study provides insight within key molecules on how surface species interact with the liquid environment, thus controlling the selectivity of this complex electro-catalytic process.
Gunathunge et al.[29]Compared with the two rough copper thin membrane electrochemical depositions, it was found that copper deposited on chemical deposits of gold membranes was less active than copper deposited chemically, and electrochemical catalytic reduction of CO to ethylene. DEMS displays the initial reduction of ethylene: the former is less than approximately 200 mV. SEIRAS indicates a clear difference in the linear adsorption of CO peaks.
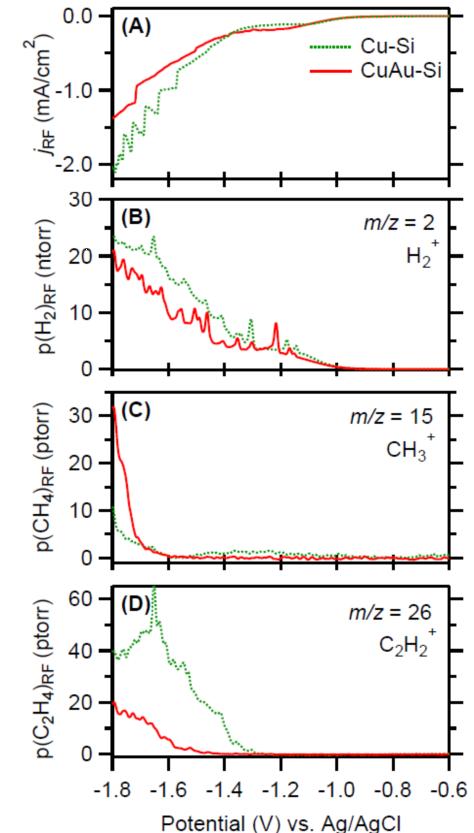
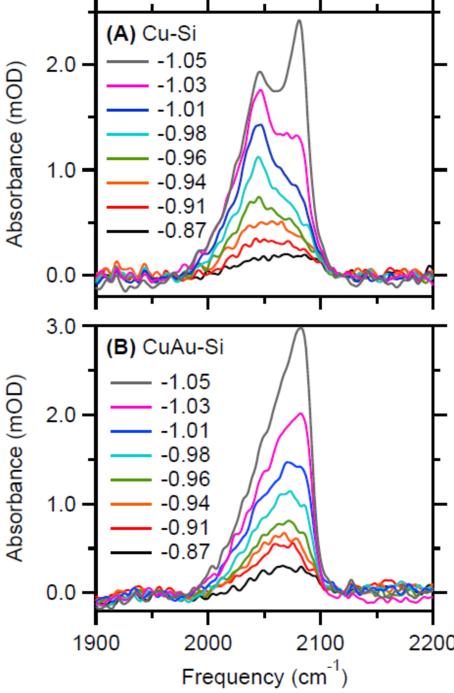
Figure 18 DEMS for Cu-Si and CuAu-Si in contact with CO-sacurated 0.1 M potassium phosphate buffer at a pH of 7.(A) Electronic records. (B) H2+ (m/z = 2), (C) CH3+ (m/z = 15), and (D) C2H2+ (m/z = 26) partial pressures. All signals in this figure were divided by the RF of the respective electrode. Potential-dependence of the C≡O stretch band of COatop on (A) Cu-Si and (B) CuAu-Si. The labels in the panels denote the electrode potential in volts versus the Ag/AgCl reference electrode.
4.2 Extended exterior reflection and ttoform flow pool
While SEIRAS based on metal surface enhancement base has had considerable success, in certain special situations, such as non-metal catalysts such as carbon materials, attempts to detect a completely metal-free environment, load-type catalysts such as carbon paper, Electrochemical pools with traditional external reflection or Otto-correstrial formations still have important applications due to the passivity limitations of the thin layer and CO2Because of, inter alia, low gas solubility, the passivation effects can be significantly increased by forcing the flow.
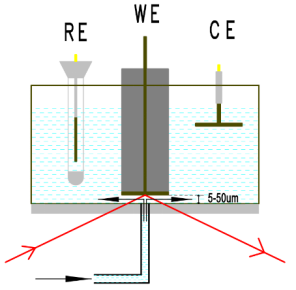
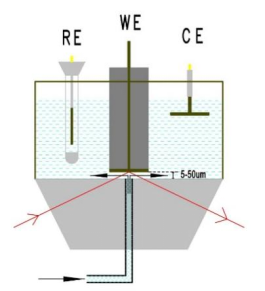
Figure 19 Infrared electrochemicals in situ in the thin layer
4.3 Infrared in situ detection of MEA electrodes
Currently, most of the infrared spectroscopy is detected at CO.2Electro-catalytic reduction reaction, or H-type pool based on traditional solids interfaces, but studies of electro-catalytic activity and selectivity (product Faraday efficiency calculations, etc.), large-scale use of MEA electrodes in gaseous diffusion electrodes have already begun, detection of the three-phase interfaces of aerosols has been initiated, and infra-red detection near actual industrial production conditions at high current density has been less reported, with the benefit of similar in situ studies of hydrogen fuel cells and direct alcohol fuel cells, which could draw on relevant electrochemical cell formations and related research methods[30], so it’s for catalytic CO2Reverted infrared detection near actual industrial production conditions requires further research and development.
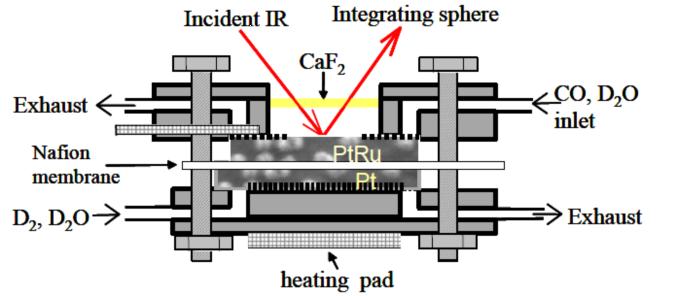
Figure 20 Schematic of operando IR cell developed by Fan et al[30]
References:
-
Albertus D. Handoko,Fengxia Wei,Jenndy,Boon Siang YeoandZhi Wei She* Understanding heterogeneous electrocatalytic carbon dioxide reduction through operando techniques Nature Catalysis volume 1, 922–934 (2018)
-
Kang Yongxia, Lee Hiro, Ip Seng Yu, Li Juntao, Zhou Xianxiang, Electrochemistry infra-red spectrum Xiamen University Journal Volume 60 No. 2 March 2021
-
Recep Kas, Onagie Ayemoba, Nienke J. Firet, Joost Middelkoop, Wilson A. Smith and Angel Cuesta In-situ infrared spectroscopy applied to the study of the electrocatalytic reduction of CO2: Theory, practice and challenges ChemPhysChem 10.1002/cphc.201900533
-
Marco Dunwell, Xuan Yang, Brian Setzler, Jacob Anibal, Yushan Yan, and Bingjun Xu Examination of Near-Electrode Concentration Gradients and Kinetic Impacts on the Electrochemical Reduction of CO2 using Surface Enhanced Infrared Spectroscopy ACS Catal. 2018, 8, 5, 3999–4008
-
Marco Dunwell, Xuan Yang, Yushan Yan and Bingjun Xu Potential Routes and Mitigation Strategies for Contamination in Interfacial Specific Infrared Spectroelectrochemical Studies J. Phys. Chem. C 2018, 122, 43, 24658–24664
-
Hiroto Miyake, Shen Ye, Masatoshi Osawa Electroless deposition of gold thin films on silicon for surface-enhanced infrared spectroelectrochemistry Electrochemistry Communications 4 (2002) 973–977
-
T. Smolinka, M. Heinen, Y.X. Chen, Z. Jusys, W. Lehnert, R.J. Behm CO2 reduction on Pt electrocatalysts and its impact on H2 oxidation in CO2 containing fuel cell feed gas – A combined in situ infrared spectroscopy, mass spectrometry and fuel cell performance study Electrochimica Acta 50 (2005) 5189–5199
-
Marco Dunwell, Qi Lu, Jeffrey M. Heyes, Jonathan Rosen, Jingguang G Chen, Yushan Yan, Feng Jiao, and Bingjun Xu The Central Role of Bicarbonate in the Electrochemical Re- duction of Carbon Dioxide on Gold J. Am. Chem. Soc. 2017, 139, 10, 3774–3783
-
Shangqian Zhu, Bei Jiang, Wen-Bin Cai, and Minhua Shao Direct Observation on Reaction Intermediates and the Role of Bicarbonate Anions in CO2 Electrochemical Reduction Reaction on Cu Surfaces J. Am. Chem. Soc. 2017, 139, 15664-15667
-
Tian-Wen Jiang, Ya-Wei Zhou, Xian-Yin Ma, Xianxian Qin, Hong Li, Chen Ding, Bei Jiang, Kun Jiang and Wen-Bin Cai Spectrometric Study of Electrochemical CO2 Reduction on Pd and PdB Electrodes ACS Catal. 2021,11,840-848
-
Anna Wuttig, Momo Yaguchi, Kenta Motobayashi, Masatoshi Osawa, and Yogesh Surendranath Inhibited proton transfer enhances Au-catalyzed CO2-to-fuels selectivity PNAS 2016 113,32,E4585-E4593
-
Charuni Menaka Gunathunge, Vincent John Ovalle, Yawei li, Michael J. Janik, and Matthias M. Waegele Existence of an Electrochemically Inert CO Population on Cu Electrodes in Alkaline pH ACS Catal. 2018, 8, 8, 7507–7516
-
Tsu-Chin Chou, Chiao-Chun Chang, Hung-Ling Yu, Wen-Yueh Yu, Chung-Li Dong, Juan-Jesús Velasco-Vélez, Cheng-Hao Chuang, Li-Chyong Chen, Jyh-Fu Lee, Jin-Ming Chen, and Heng-Liang Wu Controlling the Oxidation State of Cu Electrode and Reaction Intermediates for Electrochemical CO2 Reduction to Ethylene J. Am. Chem. Soc. 2020, 142, 6, 2857–2867
-
Nienke J. Firet, and Wilson A. Smith Probing the reaction mechanism of CO2 electroreduction over Ag films via operando infrared spectroscopy ACS Catalysis 2017, 7, 1, 606-612
-
Shuai Chen, and Aicheng Chen Electrochemical Reduction of Carbon Dioxide on Au Nanoparticles: An In-Situ FTIR Study J. Phys. Chem. C 2019, 123, 39, 23898–23906
-
Elena Prez-Gallent, Marta C. Figueiredo, Federico Calle-Vallejo, and Marc T. M. Koper Spectroscopic Observation of a Hydrogenated CO Dimer Intermediate During CO Reduction on Cu(100) Electrodes Angew. Chem. 2017, 129, 3675 –3678
-
Younghye Kim , Sojung Park , Seung-Jae Shin , Woong Choi , Byoung Koun Min , Hyungjun Kim , Wooyul Kim and Yun Jeong Hwang Time-resolved observation of C-C coupling intermediates on Cu electrodes for selective electrochemical CO2 reduction Energy Environ. Sci., 2020,13, 4301-4311
-
Wanyu Deng , Tenghui Yuan , Sai Chena,b , Huimin Li , Congling Hu , Hao Dong , Bo Wu , Tuo Wang , Jingkun Li, Geoffrey A. Ozin , Jinlong Gong Effect of bicarbonate on CO2 electroreduction over cathode catalysts Fundamental Research 1 (2021) 432–438
-
Mozhgan Moradzaman and Guido Mul Optimizing CO Coverage on Rough Copper Electrodes: Effect of the Partial Pressure of CO and Electrolyte Anions (pH) on Selectivity toward Ethylene J. Phys. Chem. C 2021, 125, 12, 6546–6554
-
Meenesh R. Singh, Youngkook Kwon, Yanwei Lum, Joel W. Ager, and Alexis T. Bell, Hydrolysis of Electrolyte Cations Enhances the Electrochemical Reduction of CO2 over Ag and Cu J. Am. Chem. Soc. 2016, 138, 13006–13012
-
Onagie Ayemoba and Angel Cuesta Spectroscopic Evidence of Size-Dependent Buffering of Interfacial pH by Cation Hydrolysis during CO2 Electroreduction ACS Appl. Mater. Interfaces 2017, 9, 33, 27377–27382
-
Soumyodip Banerjee, Zhuo-Qun Zhang, Anthony Shoji Hall, and V. Sara Thoi SurfactantPerturbation of Cation Interactions at the Electrode− Electrolyte Interface in Carbon Dioxide Reduction ACS Catal. 2020, 10, 17, 9907–9914
-
Marco Dunwell, Xuan Yang, Brian P. Setzler, Jacob Anibal, Yushan Yan, Bingjun Xu Examination of Near-Electrode Concentration Gradients and Kinetic Impacts on the Electrochemical Reduction of CO2 using Surface Enhanced Infrared Spectroscopy ACS Catal. 2018, 8, 5, 3999–4008
-
Kailun Yang, Recep Kas, Wilson A. Smith In-situ Infrared Spectroscopy Reveals Persistent Alkalinity Near Electrode Surfaces during CO2 Electroreduction J. Am. Chem. Soc. 2019, 141, 40, 15891–15900
-
Marco Papasizza and Angel Cuesta In Situ Monitoring Using ATR-SEIRAS of the Electrocatalytic Reduction of CO2 on Au in an Ionic Liquid/Water Mixture ACS Catal. 2018, 8, 7, 6345–6352
-
Zhuo-Qun Zhang, Soumyodip Banerjee, V. Sara Thoi Anthony Shoji Hall Reorganization of Interfacial Water by an Amphiphilic Cationic Surfactant Promotes CO2 Reduction J. Phys. Chem. Lett. 2020, 11, 14, 5457–5463
-
Marco Dunwell, Yushan Yan and Bingjun Xu, In-Situ Infrared Spectroscopic Investigations of Pyridine-Mediated CO2 Reduction on Pt Electrocatalysts ACS Catal. 2017, 7, 8, 5410–5419
-
Jingyi Lia, Xiang Lia, Charuni M. Gunathunge, and Matthias M. Waegele Hydrogen bonding steers the product selectivity of electrocatalytic CO reduction PNAS 2019 116 19
-
Charuni Menaka Gunathunge, Jingyi Li, Xiang Li, Julie J Hong, and Matthias M. Waegele Revealing the Predominant Surface Facets of Rough Cu Electrodes Under Electrochemical Conditions ACS Catal. 2020, 10, 12, 6908–6923
-
Qinbal Fan, Cong Pu, Kevin L. Ley, and E. S. Smotkin In Situ FTIR-Diffuse Reflection Spectroscopy of the Anode Surface in a Direct Methanol/Oxygen Fuel Cell J. Electrochem. Soc., Vol. 143, No.2, L21-L23